I have been using PRTG for monitoring our network for over 5 years now, but I never liked the look and feel of the dashboards. So when we moved to a new office it was time to get something nice on the wall.
With Grafana you can create really nice dashboard, using data from different sources. If you have a Windows environment, then the quickest way of getting up and running is using Docker.
Installing Docker
Download here the latest version of Docker for Win 10 Pro 64bit and install it. You can use Powershell or Kitematic to manage your Docker containers. If you are new to Docker, Kitematic is an easy way to get started.
Installing Grafana
If you use Kitematic, then you can simply click +new and search for Grafana. You will get a lot of containers to choose from, Grafana-xxl is a good choice because it contains a lot of plugins. After you installed the container you can set the Volumes to map the configuration file and storage location to you Host.
When using Powershell install Grafana as followed:
docker run -d -p 3000:3000 `
    -v /var/lib/grafana:/var/lib/grafana `
    -e "GF_SECURITY_ADMIN_PASSWORD=admin" `
    grafana/grafana
More info about the installation here
After you are done, you can access Grafana on http://localhost:3000 and login with admin/
Installing InfluxDB
Again, if you use Kitematic, just click +new and search for InfluxDB. Just pick the official one. Under settings, make sure you map the /var/lib/influxdb folder to your host.
If you go for the Powershell way:
$ docker run -p 8086:8086 `
      -v $PWD:/var/lib/influxdb `
      influxdb`
Change $PWD to you host folder. More info about the installation here
If you use Kitematic, you can access the Influx shell by going to Exec in the topbar. This will open a Powershell window. Type influx to connect to the InfluxDB CLI.
Create a database with CREATE DATABASE mydb . Check if the database is created with Show Databases . We are going to add some test data to it, so we can check if everything works in Grafana before we proceed:
# Select the database you just created
USE mydb

# Add some data to it (repeat it a couple of times so you can display a line chart later on)
INSERT cpu,host=serverA,region=us_west value=0.64
You can find more info about the InfluxDB shell here
Display the data in Grafana
Open Grafana (http://localhost:3000) and goto to data sources. Add your InfluxDB here:
Name: mydb
Type: influxdb
URL: http://localhost:8086
Access: Direct
Database: mydb
Goto you the dashboard and add a graph to it. Use the following metric:
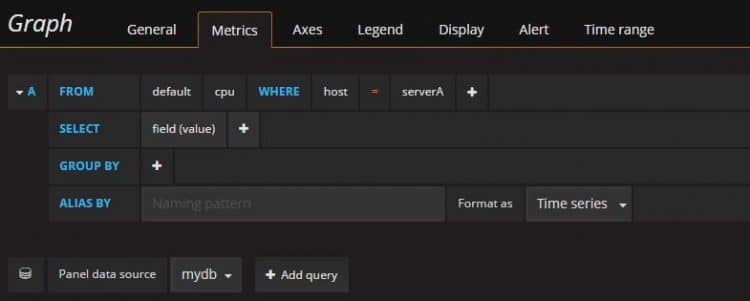
You should see a nice little line chart showing up.
Collecting data with Telegraf
To collect server, network appliance and application telemetry and metric you can use Telegraf. This will send them to a time series datastore like InfluxDB.
You can get the Docker again with Kitematic, just add a new one and search for it. I had some trouble mapping the config file, so I ended up opening the exec and using VI to change the telegraf.conf.
When using Powershell, we first need to create a place to store the Telegraf config file, then we can copy the sample config:
mkdir telegraf
docker run --rm telegraf -sample-config > telegraf/telegraf.conf
Open the configuration file telegraf/telegraf.conf and find the [[outputs.influxdb]] section. Change the url option to point at your influxdb instance. I tried using localhost:8086 but that didn’t seem to work, so I ended up adding the ip address of the host machine here.
urls = ["http://10.0.75.1:8086"] # required
database = "telegraf" # required
By default Telegraf will capture the cpu/memory/network usages of it’s host machine (the Docker container in this case). Start the Telegraf container with:
Docker run -v telegraf/telegraf.conf:/etc/telegraf/telegraf.conf:ro telegraf
You now should see some data getting into you InfluxDB. Go back to Grafana and add a new InfluxDB data source with the database Telegraf.
Later on I will write more blogpost about how I setup my Grafana dashboard. If you come from a PRTG monitoring system (and still have it running) you should really use this Grafana PRTG plugin. It allows you to show the data from PRTG on you Grafana dashboard.


Docker run -v telegraf/telegraf.conf:/etc/telegraf/telegraf.conf:ro telegraf
docker: Error response from daemon: create telegraf/telegraf.conf: “telegraf/telegraf.conf” includes invalid characters for a local volume name, only “[a-zA-Z0-9][a-zA-Z0-9_.-]” are allowed. If you intended to pass a host directory, use absolute path.
See ‘docker run –help’.
Not working
docker run -v telegraf/telegraf.conf:/etc/telegraf/telegraf.conf:ro telegraf
docker: Error response from daemon: create telegraf/telegraf.conf: “telegraf/telegraf.conf” includes invalid characters for a local volume name, only “[a-zA-Z0-9][a-zA-Z0-9_.-]” are allowed. If you intended to pass a host directory, use absolute path.
what a fuck?? now working!
Hi Rudd,
Thank you for sharing your knowledge!
When I tried to create the database in grafana, however, after clicking on ‘Save & Test’ it shows: Network Error: Bad Gateway (502).
Would you know what could have caused this problem and how can I resolve it?
Thanks,
Just found the solution to the problem reported earlier. Need to change the Access from Server (Default) to Browser.
This really helped me. Thank you!