I have been using PRTG for over 10 years now and I couldn’t do my job without them, so it’s time for a PRTG Review. At my SysAdmin job, I need to monitor the servers and infrastructure for 3 office (supporting 150 users) and more than a dozen construction sites.
I am the only IT guy, so a good monitoring tool helps me to keep one step ahead of the problems. Over the years I have tested different monitoring tools, but the ease of configuration and the possibility to fine-tune every little detail of a sensor made my choices for PRTG every time.
If you look around on Reddit /r/SysAdmin or on Spiceworks you will see this question a lot:
“What is the best Network Monitoring Tool?”
There are literally dozens of questions and polls on Reddit and Spiceworks with this question, and every time PRTG is the most used or recommended network monitoring tool for both Windows and Linux.
The reason? Paessler PRTG is really easy to setup and use. It comes with a lot of sensors that work just out of the box and the pricing structure is awesome. You can get 100 sensors for free and the first plan starts at only $ 1.600,- for 500 sensors.
I included unbiased social media evidence in this PRTG Network Monitoring Review… Just remember, a good monitoring tool is still the most important tool for a system administrator!
If you have any questions, just drop a comment below 😉
#1 on Reddit and Spiceworks
Let’s start with the social evidence part to save you time from doing any further research. I gather some Reddit questions and a Spiceworks poll about network monitoring.
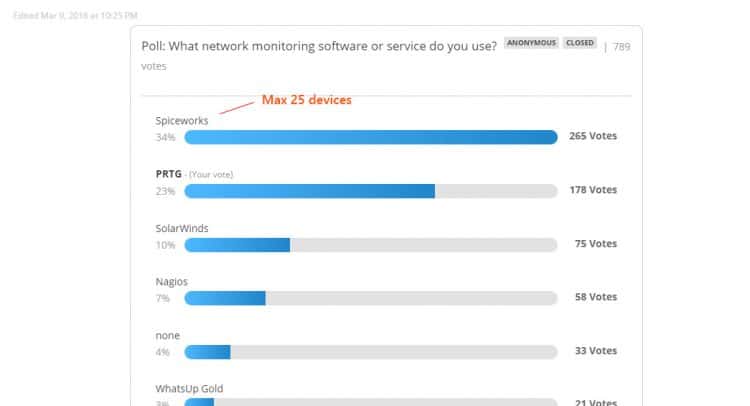
Here is a Spiceworks poll that was taken in 2016. PRTG is in the second place, but the Spiceworks Monitoring Tool is only suited for 25 devices, so not a real competitor. You can see that PRTG is by far the most popular network monitoring tool. (and keep in mind, the poll was taken on Spiceworks, so you will find the most Spicework enthusiast there)
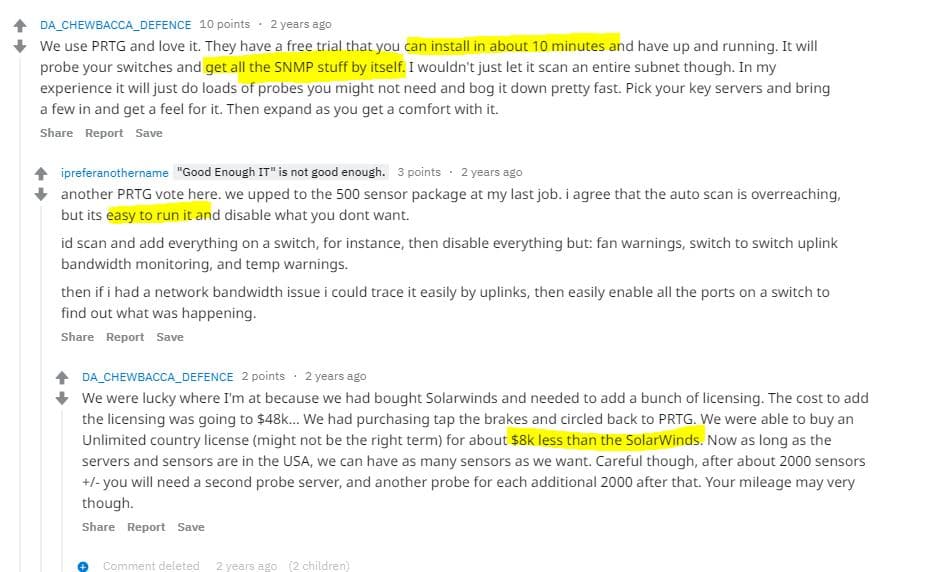
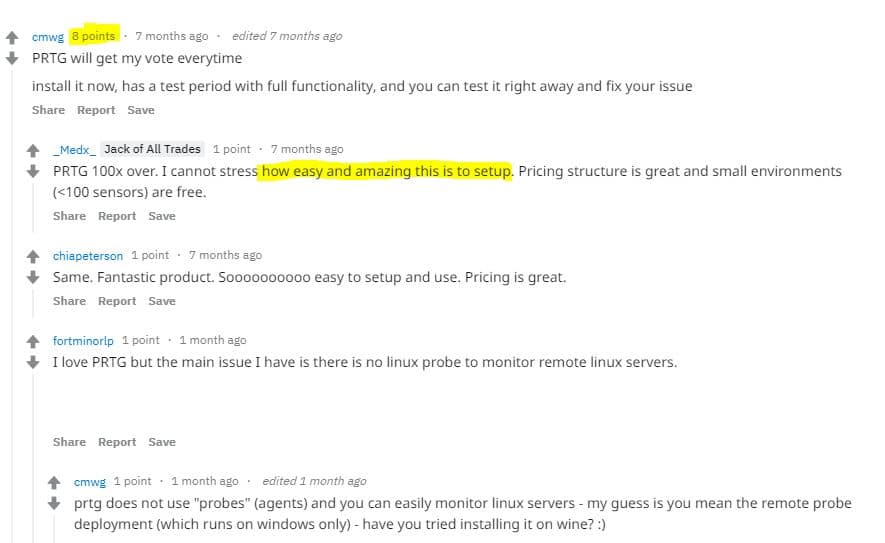
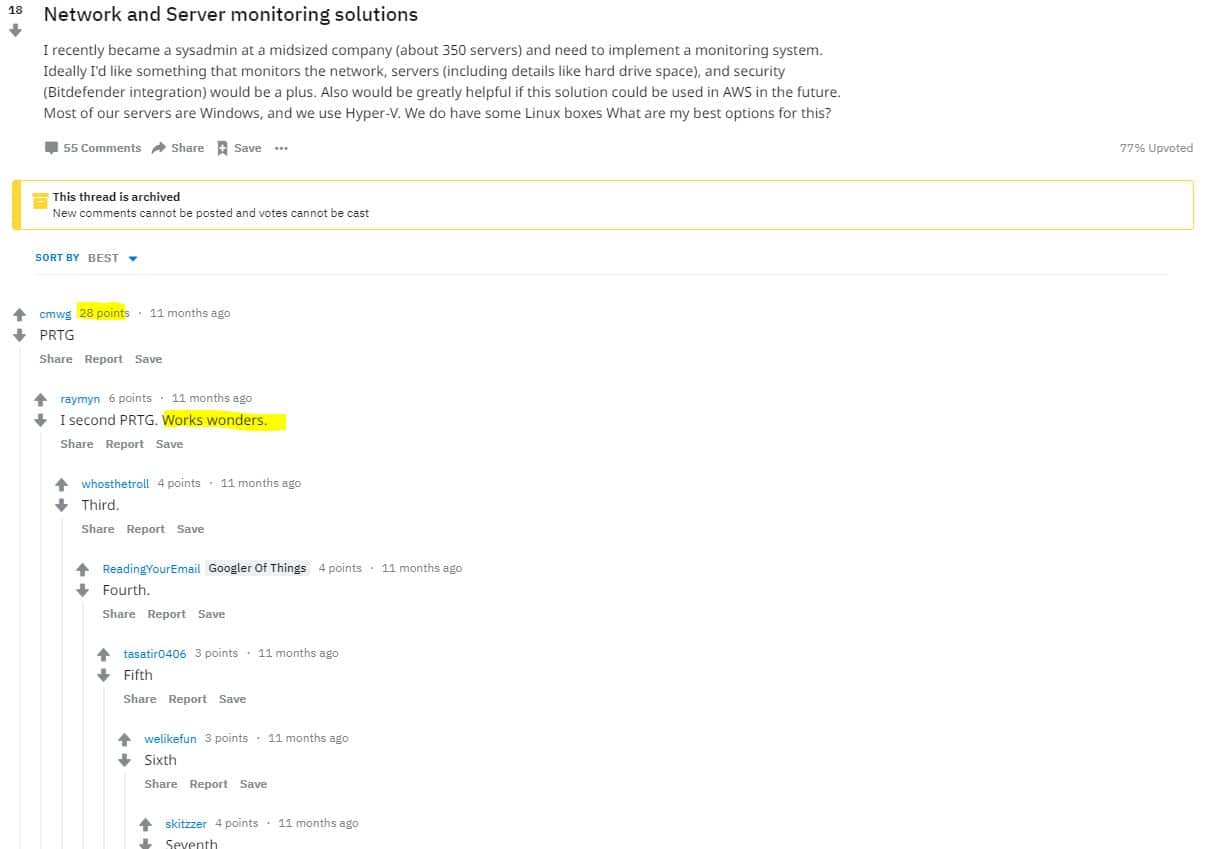
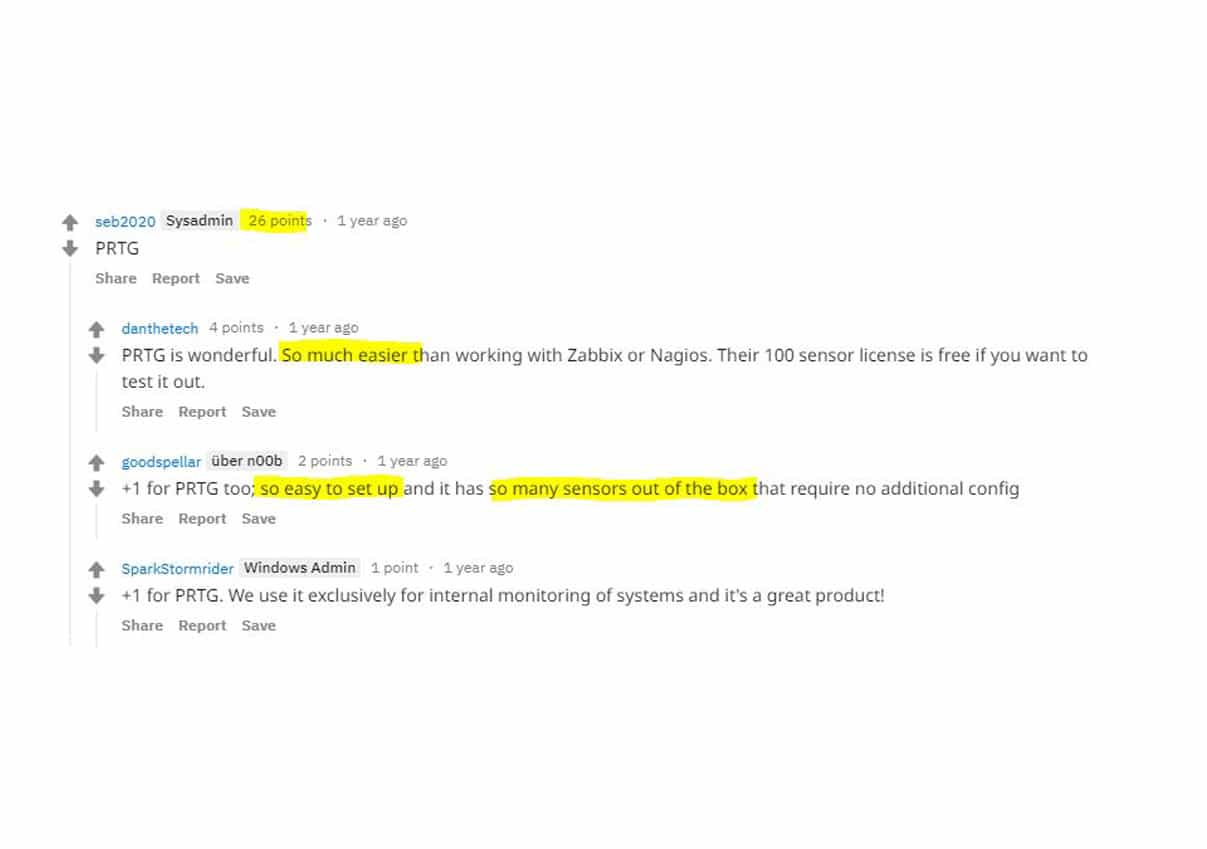
Also on Reddit, is it the most recommended and praised monitoring tool. If we take a look in the /r/sysadmin you will see numerous recommendation in favour of PRTG:
Why I Use Them
I have used PRTG for more than 10 years now. Why? Simple because of the following reasons:
- They support 237 different sensors (almost every devices can be monitored out of the box)
- You can start with 100 free sensors
- Has a mobile app so you can check your network on the go
- Custom Sensors (scripts) possible for special situations
- Remote Probe’s to split the load or to monitor branch offices
- Up and running in 10 minutes
- Powerfull autodiscovery finding all possible sensors on a device
- Notification through push messages, email, SMS or even to Microsoft Teams
- Reporting tool to analyze historical data (really useful if you are buying your next storage solution)
- Map designer for a quick overview of your network
- You can integrated it with a Grafana Dashboard
- Frequently updated and new sensors are added
Remote Probes
An important part of network monitoring are remote probes. They allow you to collect data locally from different sites, which is send the to main server for the alerting.
When you install PRTG you will get a Core Server with a Local Probe. The Core Server stores the data, runs the web server, does the alerting and a lot more. Where the probe actually collects the data from all the sensors. Now in a small local environment, one machine will do just fine collecting and processing all the data.
The most common use for a remote probe is to collect the data from a branch office. If your network is separated by a firewall and the local probe can’t collect the data, then you can use a remote probe that you install at the branch office. The remote probe can connect to the core server through your firewall and even over the public internet. So the data is sent back to the core server to be processed.
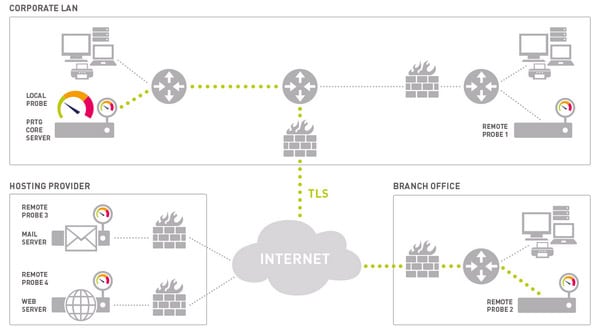
Another reason to use the remote probes is when you want to use NetFlow or Packet Sniffing sensors on another server or computer. By installing the remote probe you can read out every little detail of the Ethernet traffic.
Remote Probe Requirements
The requirements of the PRTG Remote probe are really low. I installed it on one of the application servers that are already running on the remote offices. But if we check the system requirements it only requires on a Win 10 OS with 2GB memory.
So you could actually use an Intel Stick, that cost around the $ 150, to run a remote probe. The only downside of the Intel Stick it that it connects over WiFi.
Using PRTG in a Large Installation
PRTG is really capable of monitoring large installations. More then 50.000 sensor is not a problem from PRTG, but you need to plan your installation up front to make sure everything is running smooth. The amount CPU’s and RAM needed for the hardware all depends on the amount and type of sensors you are planning to use. Some sensors, like the WMI, NetFlow and VMware sensors, require more resources than the much lighter SNMP, Ping or HTTP sensors.
A basic rule of thumb for the required hardware is one CPU core and 1 GB RAM per 1,000 sensors with a minimum of 2 GB RAM for the core server. The amount of store can be calculated to, you need about 200 KB per sensor per day.
If you don’t have the budget for the required hardware you can lower the number of resources by lowering the scan interval. The default scan interval is 60 seconds. But let’s be honest, you don’t need to check that SSL certificate every minute, one per day is enough. The amount of free space? check it every 10 min or maybe one in the hour for non-critical servers.
Scaling down the scan interval allows you to run more sensors on the same hardware.
If you are planning to use PRTG for a large installation, you should check out this knowledgebase article PRTG Planning Large Installation.
Creating PRTG Maps
An important part of networking monitoring is a good dashboard. You want to see the status of your network in one overview and not solely rely on the notifications. When you open PRTG you will see the device tree with the option to switch between a few different views. These dashboards can’t be customized but that isn’t a big deal. PRTG has an awesome map designer that allows you to create a stunning dashboard with all the info on it you need.
If you Google for PRTG maps you will find a lot of example with the famous PRTG sunburst view or only lists with sensors. Now the sunburst looks really nice, but if you put that up on a screen, nobody can tell which part of your network is down without walking to the screen. It is good to know that the map designer allows you to do so much more.
You could create your own background for a map, allowing you to visualize a business process with the sensors on it. Or you could use a county map as a background to monitor every site of your company. What I like to do is create a zoomed out visual presentation of the network. You really don’t need all the sensors on your map, just the most important ones.
Below is an example of one of my maps:
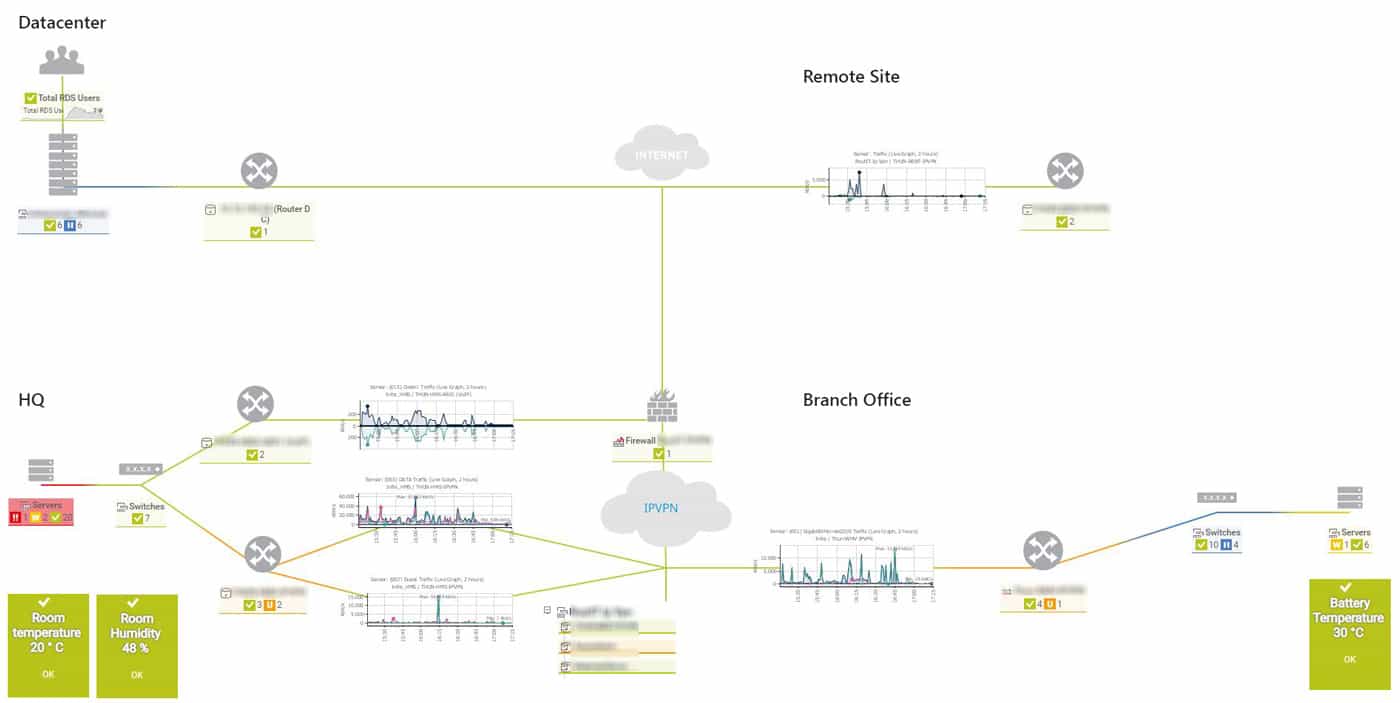
Everybody that takes a look at this map can see which part of the network is affected by a potential issue. We got here 3 offices and a remote data center (that we don’t manage our self, so we only check if the servers are up or not).
Tips on creating PRTG Maps
The structure of your PRTG sensors really determines the ability to create a stunning map or not. Start with using a probe for every site that you want to monitor, then group your devices in a logical way. If you group your switches, you can just drag the Group onto the map, monitoring all your switches witch just one icon on the map.
For important sensors, I like to use the Status Icon -> Name and status (sizeable, status-related background) icon. This will colour according to the sensor status and display the primary channel on it. They are really useful for monitoring applications and services. In the map above I used it for monitoring the server room temperatures and humidity.
PRTG Pricing
Another reason why I like PRTG, transparent pricing. I really hate when I am looking into a software solution and you need to contact sales to get a quote. PRTG has a really simple pricing model. You can buy a license for a fixed price that is valid forever depend on the number of sensors you need. No monthly subscriptions are needed to keep your PRTG running.
There is no feature limitation with to lower plans. All the pricing plans include all the sensors, a failover node and unlimited remote probes.
I do recommend buying the additional maintenance though. This way you can always update your PRTG server and receive the latest sensors. Also, maintenance allows you to get support from PRTG. All plans come with 12 months maintenance included and you can extend this up to 3 years (giving you a 15% discount)
| PRTG Plan | With 12 months maintenance | With 24 months maintenance | With 36 months maintenance |
|---|---|---|---|
| PRTG 500 | $ 1,600.- | $ 1,960.- | $ 2,280.- |
| PRTG 1000 | $ 2,850.- | $ 3,491.26 | $ 4,061.25 |
| PRTG 2500 | $ 5,950.- | $ 7,288.74 | $ 8,478.75 |
| PRTG 5000 | $ 10,500.- | $ 12,862.50 | $ 14,962.50 |
| PRTG XL1 | $ 14,500.- | $ 17,762.50 | $ 20,662.50 |
| PRTG XL5 | $ 60,000.- | $ 73,500.- | $ 85,500.- |
PRTG Maintenance Price
The prices for renewing your PRTG maintenance are not available online. But here is an overview of the prices you can expect for renewing:
| PRTG Plan | 12 months maintenance | 24 months maintenance | 36 months maintenance |
|---|---|---|---|
| PRTG 500 | $ 400.- | $ 760.- | $ 1,080.- |
| PRTG 1000 | $ 712.50 | $ 1,353.76 | $ 1,923.7 |
| PRTG 2500 | $ 1,487.50 | $ 2,826.24 | $ 4,016.25 |
| PRTG 5000 | $ 2,625.- | $ 4,987.50 | $ 7,087.50 |
| PRTG XL1 | $ 3,625.- | $ 6,887.50 | $ 9,787.50 |
| PRTG XL5 | $ 15,000.- | $ 25,500.- | $ 40,500.- |
If you want to know the exact price for your license, you can check here at the PRTG website.
Getting Started with PRTG
To get started with PRTG is really easy, you can get it up and running within 10 minutes. PRTG offers a trial and a free version. If you have a really small network you could start with the PRTG Free plan, that is limited to 100 sensors. No internal budget approval is required and you can start monitoring your network within minutes.
But 100 sensors is really limited even for small IT departments, you will have to be very selective with what you are going to monitor. So to get a good feel of PRTG I recommend you start with the PRTG Trial which you can download from there site. You can test the trial for 30 days without any limitations (that means, unlimited sensors).
After you downloaded and installed PRTG Server you need to navigate to http://servername to get started.
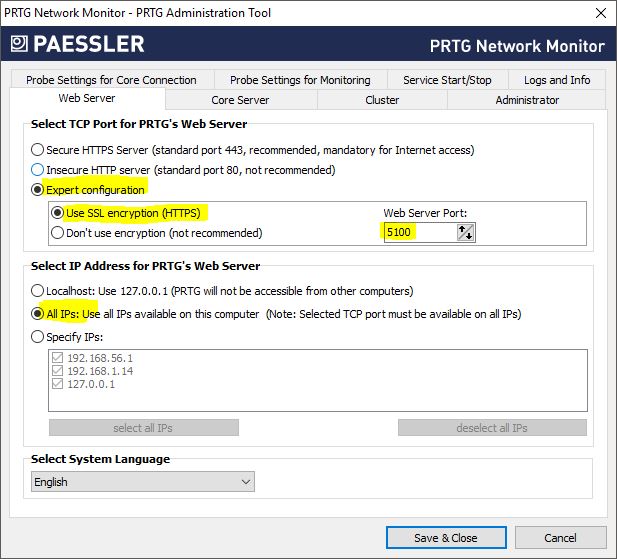
Changing the default port number
PRTG runs by default on port 80 or 443 if you want to use https. You can change these ports by opening the PRTG administration console on the server. On the first tab, web server, you can select Export Configuration and set a different port for your PRTG Installation so it doesn’t conflict with any other web application that might be running on the same server.
Start scanning your network
So we are now logged in for the first time in PRTG. You should change that password as recommend but when you are done go over to the devices page. PRTG will scan you network an run the auto-discovery function on the devices it finds.
Now, this can get a bit overwhelming so what I like to do is remove the default Network Detection group. This way you are left with only the local probe. Now we can start laying out our structure before we add devices.
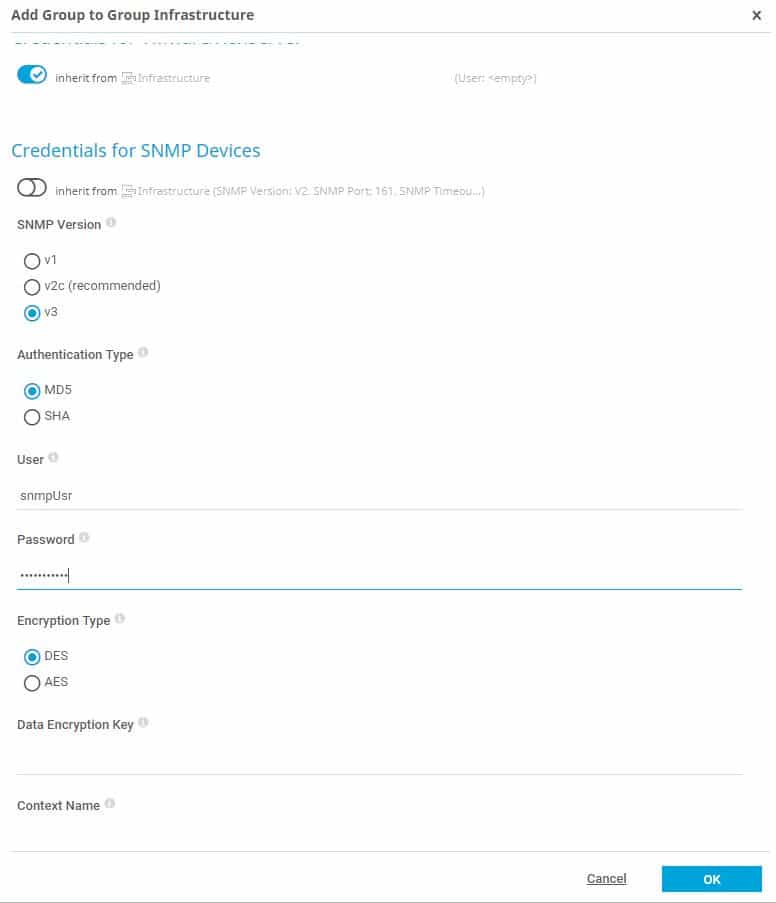
Start adding new groups under the local probe, for each group you can set the default credentials that are used for scanning the devices. So we are adding a group for the switches, we can set the SNMP v3 credentials for all the devices at once
Group Details
After you created the groups can set some more details per group. Just open a group and go to the settings page. Here you can set Geolocation of the group (you can set this also on the probe for all the groups), very useful for creating geo maps. And you can set the notification triggers per group.
Setting those notifications will be some trial and error to see what is working out for you. But setting this on a group level, and thus making more groups, really helps to manage your monitoring system.
Conclusion
I hope you found my PRTG Network Monitoring review helpful! If you have any questions just drop a comment below. I really like PRTG, it saved me a lot of time and headache over the years.
See also: Installing Grafana, InfluxDB Telegraph using Docker
PRTG Network Monitoring
$ 1,600.00
Pros
- Most recommend on Reddit and Spiceworks
- More then 230 sensors supported
- Super easy to install and setup
- 100 Free sensors
- Powerfull autodiscovery
Cons
- No dark themed dashboards


Only need sla reports.
Muy buena review. Uso PRTG desde hace 3 años y comparto cada uno de los puntos que detallas. Además de Teams es capaz de enviar SMS. Me encanta.
Saludos desde Argentina