Are you going to be ahead of the problems or running behind it? Network monitoring, every IT Department should have it. Without a monitoring tool, you get a reactive IT department. If people can’t save their files anymore you are already too late. And what about disk swapping because you are running low on memory? These kinds of scenarios happen in every IT environment and can easily be prevented with a good monitoring solution. And if you don’t have a budget for it, a free networking monitoring tool will do just fine.
Also for the smaller networks, it makes sense to install a light and free network monitoring tool. At home you are not working continually with your network, so why not at a little monitoring solution to it that will alert you when something is not working?
With a network monitoring tool, you get insights into your network, historical data that you can use when you need to renew your hardware and the opportunity to gain the maximum performance out of the resources.
In this blog post, we will look into some of the best free and open source network monitoring tools and some tips on how to use them.
Using network monitoring tools
In my 15 years as a SysAdmin, I always used a network monitoring tool. If there wasn’t a budget for a network monitoring tool, then I used one of the open source tools. But what I didn’t want is running blind, because that is what you are doing without monitoring tool. Because let’s be honest, are you checking memory usage, disk space, system load, if services are running etc manually every day? If so you for sure have to much free time left.
A monitoring tool allows you to be ahead of the problems and to use the resources to its full potential. If you have a server cluster or a Citrix farm, then you want to make sure that load is evenly spread and that there is enough resource available of any growth in the upcoming months. And not only the servers need your attention, bandwidth usage, switch load, router status, ping times, all critical information you need to get the maximum performance out of your network.
Also when you need to buy new servers or networking equipment, the data your gather over the years will give you valuable insights into the growth of your network. This helps you make sure you disks a big enough and you have enough resources for the 5 years.
Selecting a monitoring tool
There are a lot of monitoring tools available, free or paid. So how are you going to select the right tool for your network? To help you narrow down the list here are a few criteria’s you might want to compare the different tools on:
- OS – Some tools run only on Windows or Linux.
- Auto-discovery – To make the installation a lot faster, some tools provide an auto-discovery option. They scan the network for the devices that can be monitored. This will save you a lot of time in setting up your monitoring system
- Alerts – Do you want to receive an SMS or is email enough?
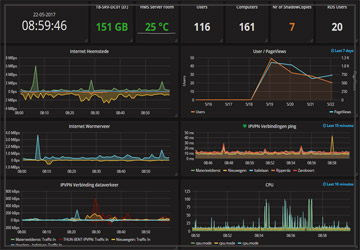
- Dashboard – I love a nice dashboard on the wall so I can see the important details in a glance.
- Reports – Do you need reports that can be sent to manage?
- Cloud – Running the monitoring on-prem or in the cloud?
- Support – Some tools offer paid support or it’s included in the license fee.
Free network monitoring tools
I created a free networking monitoring tool list with the most popular tools that are available. If you don’t have the budget for it, these free tools can be a great solution. Most of them come with a big community that can help you if you have any questions. The downside of free network monitoring tools is that you don’t get support from the maker, and in my experience, the installation and configuration required a bit more work then with the paid solutions.
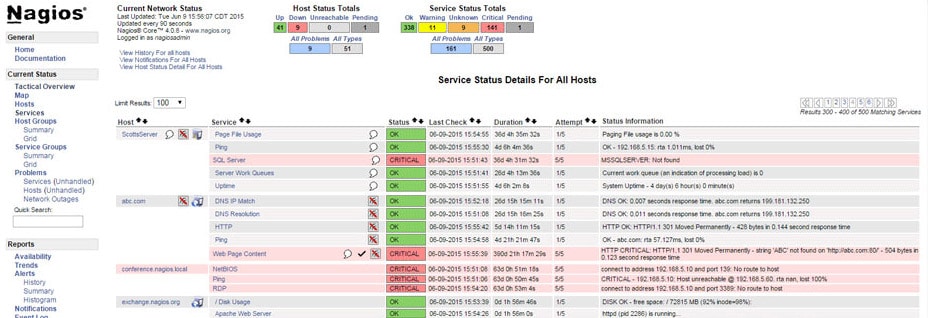
1. Nagios Core
Nagios is one of the oldest free network monitoring solutions there is. The first version of Nagios Core was released in 1999 and named NetSaint but renamed to Nagios in 2002. Nagios is one of the most used open source monitoring tools in the world, used for monitoring servers and network performance.
I have used Nagios in the past and it’s a great product, but with a really steep learning curve. You will have to put a lot of time into it to get it running and to set up all the configuration. Plugins for Nagios can make it easier, but by default, all the configuration is done through text files. That, in combination with an out-dated web interface, scares off a lot of new users. The first time I started with Nagios I gave up after a couple of days (but that was 10 years ago).
But if you pull through and you get familiar with the system, you will see the huge potential and power of Nagios. If you want to get started with Nagios, I recommend checking the Adagjos web-interface plugin for Nagios. This allows you to do a lot of the configuration through the web interface. There is also a huge community behind Nagios Core, with a lot of plugins, so if you have a question or looking for something specific, then there will probably a plugin for it.
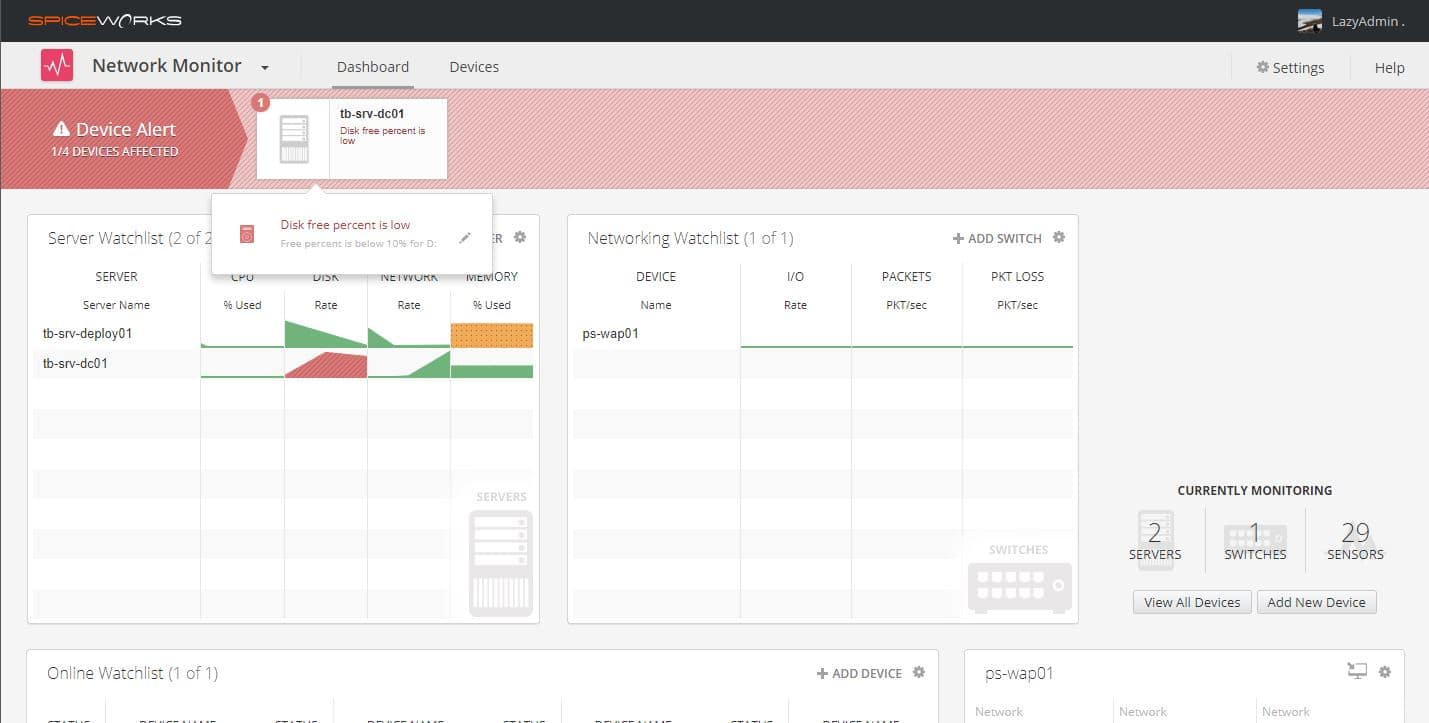
2. Spiceworks Network Monitor
If you have a small network and you look for a simple and easy to set up a monitoring solution, then Spiceworks Network Monitoring can be a good fit. It’s free but is designed for companies that want to monitor fewer than 25 devices.
Spiceworks offer real-time monitoring, a great dashboard and customizable alerts. You can choose for each device if you want to receive an alert for each type of sensor. The monitoring tool is pretty basic, you add the devices based on their IP address. It supports only SNMP v1 and v2 and WMI based sensors. If you add a device it does a pretty good job of finding the available sensors.
Spiceworks Network Monitor only runs on a Windows machine and is really easy to set up. Just run the executable and go to localhost:8080. The interface is clean and nicely done. The dashboard is divided into servers, network devices and online watchlist. These 3 options together give you a good overview of your network.

3. Zabbix
A free enterprise-class network monitoring solution. Zabbix is made for big enterprise-level infrastructures, it supports more 100.000’s devices, high availability setup, remote probes and has a strong security solution. Zabbix can monitor every little detail of your network, think of databases, hardware, services, KPI / SLA ‘s beside the obvious network and server monitoring.
The central part of a Zabbix installation is the Zabbix Server. The processing of statuses and sending the notifications are all done by the server and displayed on the web interface. The Zabbix Server itself can’t do really much, by default it can only do some simple checks like a ping, check if a port is open or if a webpage has a specific keyword.
So you want to expend those features and you can do that with the Zabbix Agent or SNMP-Daemon. These will give you a more details status report on the active processes, bandwidth usage and processor details.
Another important piece in a Zabbix installation is called Items. They gather the information from a host that is used to make the notification decisions and to display the charts in the web interface. These items can be made specific for one server or used in a template for a whole group of servers. Now you don’t have to create those items your self, there a 1000’s available online.
Deploying and setting up Zabbix isn’t done in a few clicks. It runs on Linux and to get running you really should have some Linux experience. Also, you will have to take your time for it to get your head around how the triggers, items and notifications work. The monitoring is done with agents and they are available for pretty much every device. Also, there are 1000s of pre-built monitoring templates for Windows and Linux that you can use.
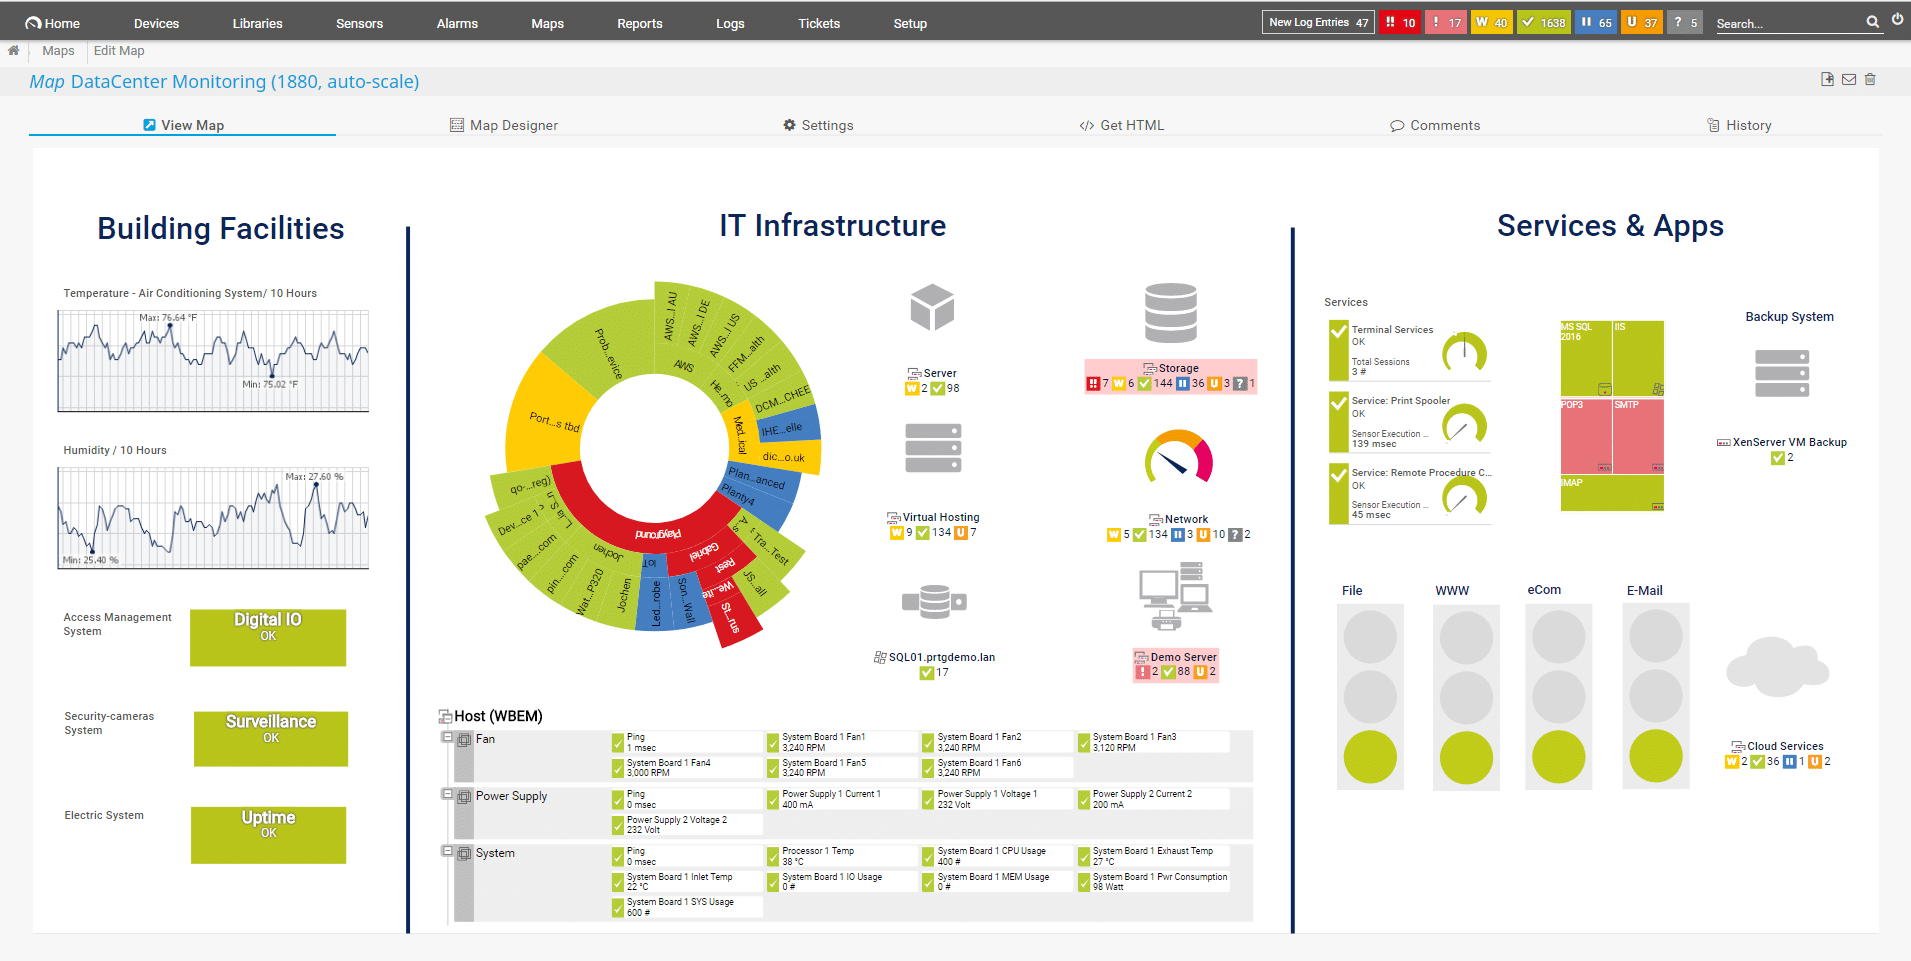
4. PRTG Network Monitor Free
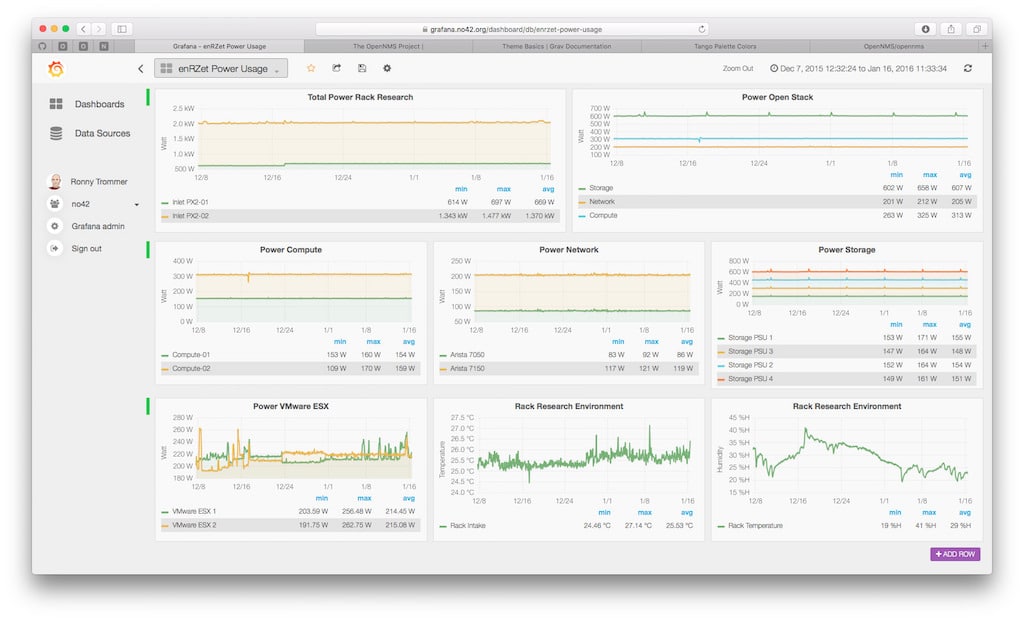
At the moment I am using PRTG combined with Grafana to monitor my network. I always liked PRTG, it is easy to set up, has a great autodiscovery feature and can monitor pretty much everything you can think of. Some of the sensors I really like are the NetFlow and application monitoring sensors. They give you a great insight and can really help track down issues on your network.
In PRTG you can set up different alerts, but also automated triggers to run scripts in an event a sensor turns to status down for example. This way you can restart services when they don’t respond anymore or do other neat things to automate your network.
With PRTG you can also add your own sensors, based on scripts or SNMP MiB libraries. So it gives you a lot of freedom besides the already extensive amount of default sensors. Monitoring your Hyper-V server, with one click you get all the important sensors you need to monitor the Hyper-V’s vitals.
PRTG offers paid solutions, but they also have a free version available. The free version is limited to 100 sensors which are enough for small networks. By default, PRTG has a good dashboard/network map tool built in, which allows you to great nice network maps with the sensors on it. PRTG also has a mobile app so you can monitor your network remotely.
If you want to know more about PRTG, you really should check this in-depth review of PRTG.
5. OpenNMS
OpenNMS comes in two flavours, Horizon and Meridian. The latter is for big enterprises that want a stable and long-term supported solution. Horizon can also be used in enterprise networks but will get the new features quicker so it supports the latest technologies. Both flavours of OpenNMS are open source and come with a lot of features, like automated discovery, event management, performance management and of course notifications.
While the software is Opensource, only the Horizon version is free. If you are looking for the stable version you will have to pay a lot of money subscription and support. So if we look at the free version, you can install it on pretty much any OS and they even have a docker container available. So you can be up and running in minutes.
OpenNMS has a nice web interface and even supports Grafana if you want to create stunning dashboards.
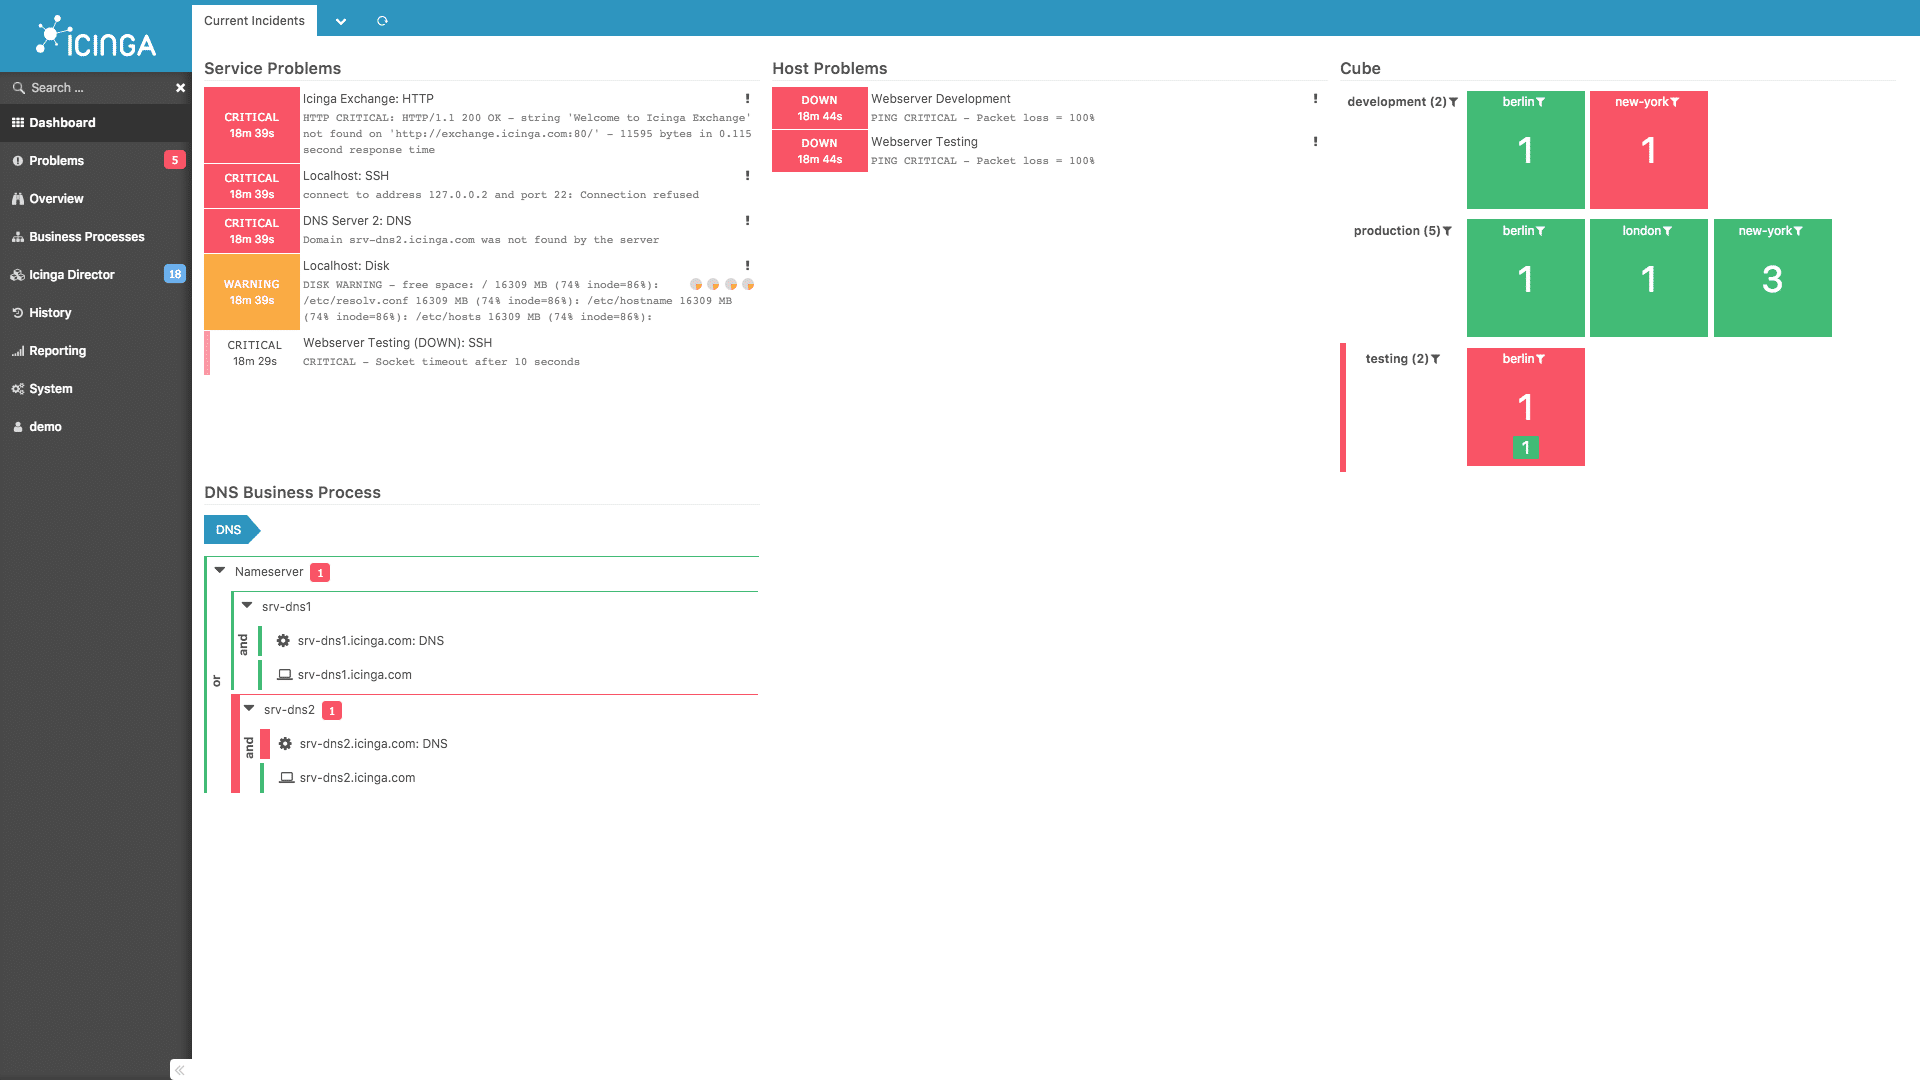
6. Icinga2
Icinga is originally created as a fork of Nagios Core with the goal to add new features, a better web 2.0 style interface, other database connectors and a Rest API. It’s free and open source and maintained by a dedicated team.
What makes Incinga2 different from the other is the Rest API that plays a big role. You can use the API to update the configuration on the fly or to pull information from the system. The new web interface is really fast and can be customized with modules.
If you are going to start with Icinga 2, make sure you check out the Director-assisted module. This makes adding agents a lot easier because by default you will need to do a lot of configuration when you want to add an agent to your system. Using the Director can save you a lot of time.
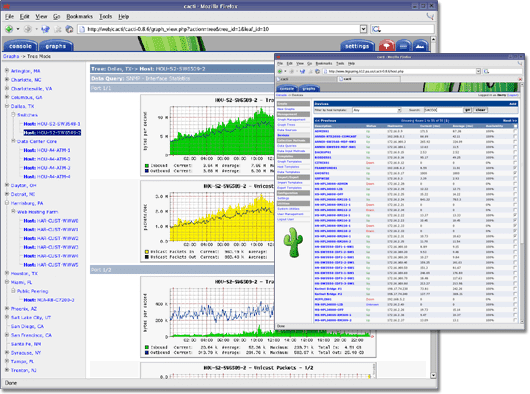
7. Cacti
It looks old and it’s old, but Cacti is also still being maintained and next to Nagios a pretty popular monitoring tool. Cacti is also one of the oldest monitoring tools around (MRTG is older). It uses only SNMP to gather data, but because it’s a really simple product, you can easily write your own script to gather the data.
Cacti is written in PHP and uses a MySQL database to store the data. So with PHP, you can really easy modify the Cacti installation to your needs. It comes with some built-in templates for several devices that help you get started monitoring.
Cacti still have a really active community, resulting in a lot of templates, scripts and add-ons that you can download. What Cacti really is missing by default is an alert feature, but that problem is already solved with an addon that you can download.
So if you are looking for a nostalgic, but really reliable monitoring tool, then take a look at Cacti.
Monitoring your home network
So in this article, we discussed the different free network monitoring solutions. As mentioned earlier, monitoring your home network can give you a lot of insight on your home network. For a home network, you really don’t need a big enterprise solution of course. You want something that is small, doesn’t require a lot of resources and is easy to set up.
For home use, PRTG is really the best option to go for. The free version comes with 100 sensors, which is more than enough to monitor your home network. Read this article to get started with PRTG for your Home Network
Tips on IT monitoring
Over the years I gained some experience in settings up network monitoring. So here are some tips when you get started setting up your new monitoring solution:
1. The naming of devices and sensors
From the beginning, give your devices and sensors a logical name. In PRTG for example, every ping sensor you add is called ping x. If you are setting up alerts, and you get a notification Ping 3 on server x is down… That’s not really useful. Name your devices and sensors in a logical way so you can easily find them.
2. Grouping of devices
Group your devices based on their physical location, type and function. It not only gives you a better overview but in PRTG for example, you can store login credentials per device group. Also, it helps when you are generating reports
3. Keep your dashboard clean
The dashboard is for the most important information. Don’t fill it up with every little detail and sensor you have. Just make sure the most important sensors are displayed. You can always drill down when an alert goes off.
4. Fine tune the alerts
If you get too many alerts then you end up ignoring them. Trim your alert so they are only sent when you need them, how often they are sent and set appropriate thresholds.
5. Prioritize
Some monitoring solutions allow you to prioritize sensors, making them more sensitive than others. Use these features, because not all the systems are critical.
6. Check the baseline
Don’t make the rookie mistake to only send an alert if you don’t get a ping response. After running your monitoring solution for a week or so, you have a baseline. You now know what is normal, 5ms to ping Google? Then send a warning when it’s 10ms for 30sec, so you know up front that something is out of the ordinary.
Conclusion
Share your thoughts below in the comments, if you have a good suggestion for the list of free monitoring tools just let me know. The list above isn’t the complete list of every available tool but is based on my own experiences, the tools I tested or used the past years.
See also:
PRTG #1 Monitoring tool on Reddit and Spiceworks (review 2018)


PRTG is oude zooi uit de jaren ’90, die alleen op Windows draait. Wie gaat er nou thuis een Windows PC dag en nacht aan laten staan voor wat monitoring van zijn switch en router? Daarvoor zijn NAS-sen nou juist uitgevonden, die staan 24/7 aan en zijn energiezuinig.
En dus Linux, en dus Docker.
Kun je geen uitgebreide tutorial voor networkmonitoring in Docker en de marktleider, Synology, maken? Voor een van die gelikte tools met Grafana?
Nou oude zooi.. zakelijk zijn ze nog steeds één van de grootste. Maar ben het met je eens, een oplossing op basis van Synology en Docker zijn mooier voor thuis.
Persoonlijk ben ik meer fan van Unifi netwerk spul, hiermee kan je je netwerk prachtig monitoren.
Maar als ik tijd heb zal ik is kijken of we iets met Synology en Docker kunnen doen 😉
Good information, thanks!
But, it looks the list misses 1 great free and very easy program:
https://nicekit.com/net-monitor/best-free-net-monitor.htm
Fantastic easy program! Its FREE!